Detailed Report
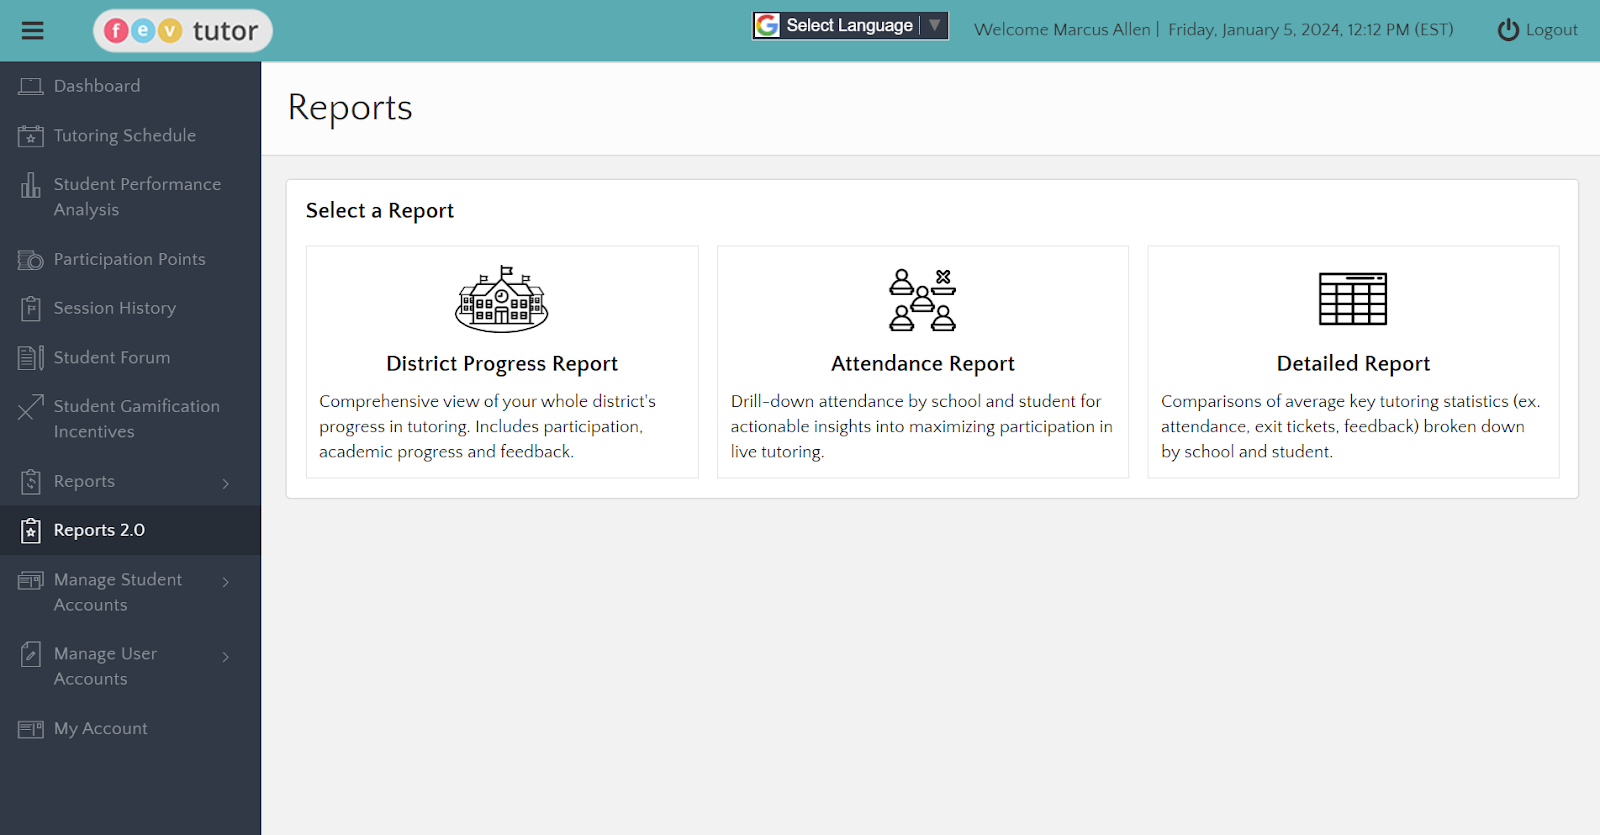
The Detailed Report is an all-encompassing resource for district school administrators, providing in-depth insights into key performance indicators (KPIs) tracked by FEV Tutor. Unlike the Attendance Report, which focuses mainly on attendance and utilization, the Detailed Report offers a comprehensive analysis of various critical metrics. These metrics are organized by school, allowing for a comparative view across the district. Additionally, a separate tab delves further into individual student data, offering a deeper level of detail. This report is especially valuable for administrators seeking a thorough & detailed understanding of both school-wide and student-specific performance within the FEV program. All this data can be exported into an excel spreadsheet.
Select the "Reports 2.0" tab on the left-hand navigation and choose the middle option "Detailed Report"
Configure your preferred Date Range, School(s), Subject(s), and Grade(s) or stick with these default filters:
Date Range - Academic Year (August 1st of the current school year through present day)
School(s) - All (includes all schools in the district)
Subject(s) - All (includes all tutored subjects)
Grade(s) - All (includes the grade levels of all participating students)
Note: your selected filters will apply universally to all components of the below reports.
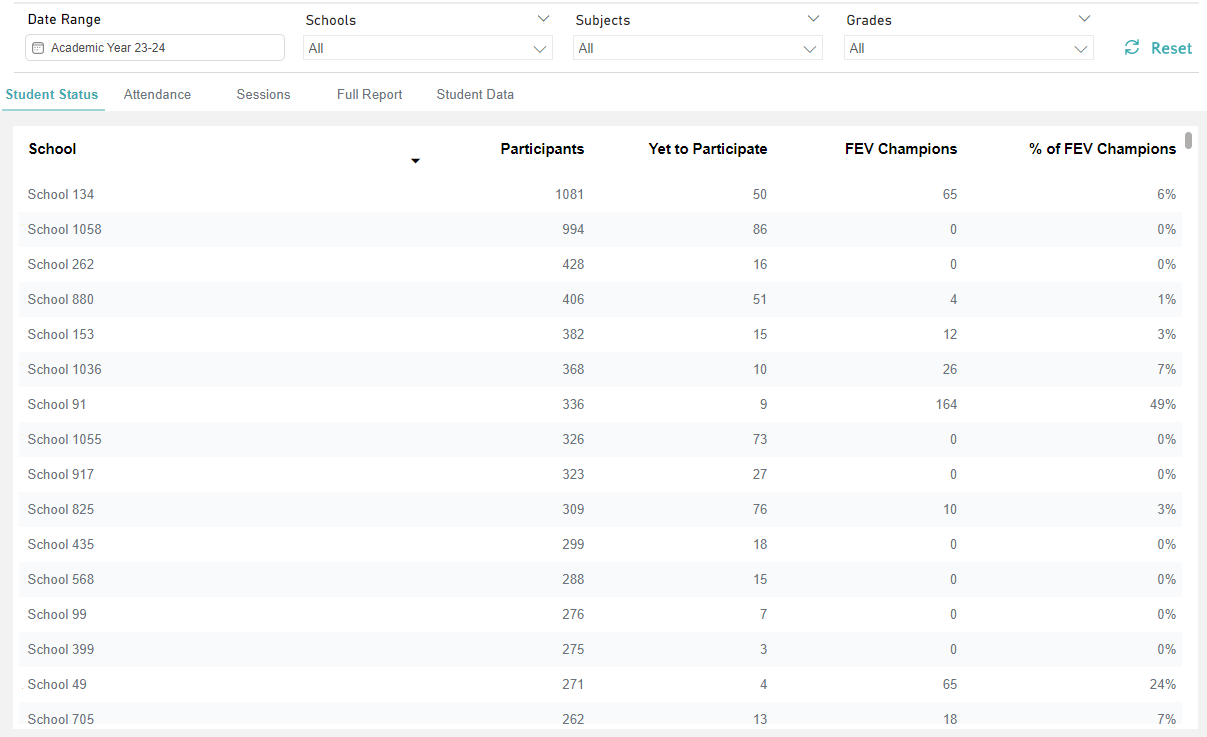
Student Status
Select the "Student Status" tab across the top to see student participation comparisons by school, able to export data to Excel
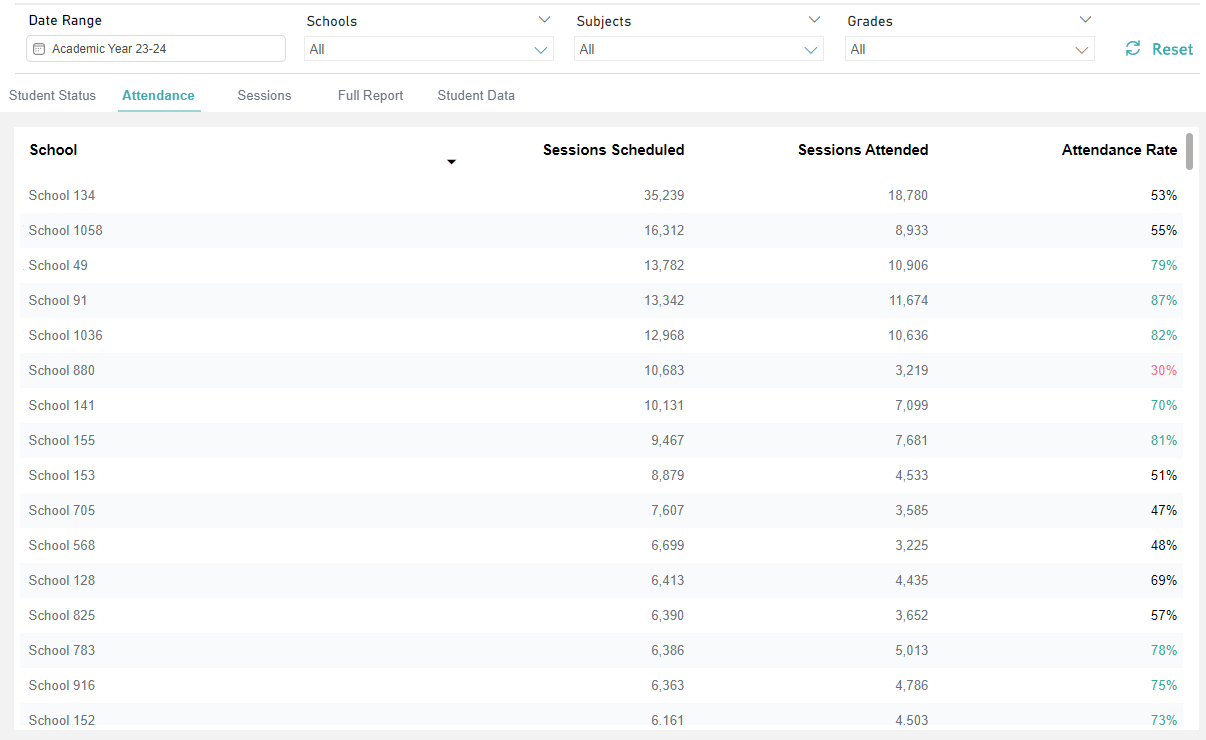
Attendance
Select the "Attendance" tab across the top to see attendance comparisons by school, able to export data to Excel
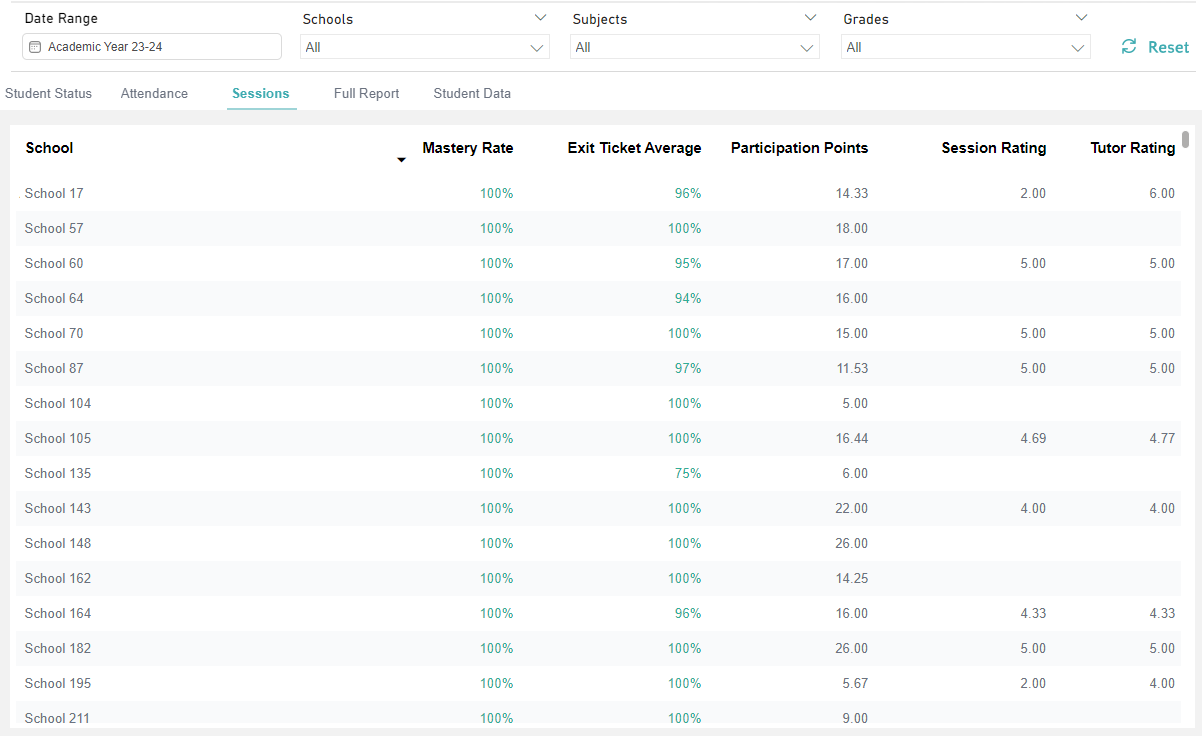
Sessions
Select the "Sessions" tab across the top to see session KPI comparisons by school, able to export data to Excel
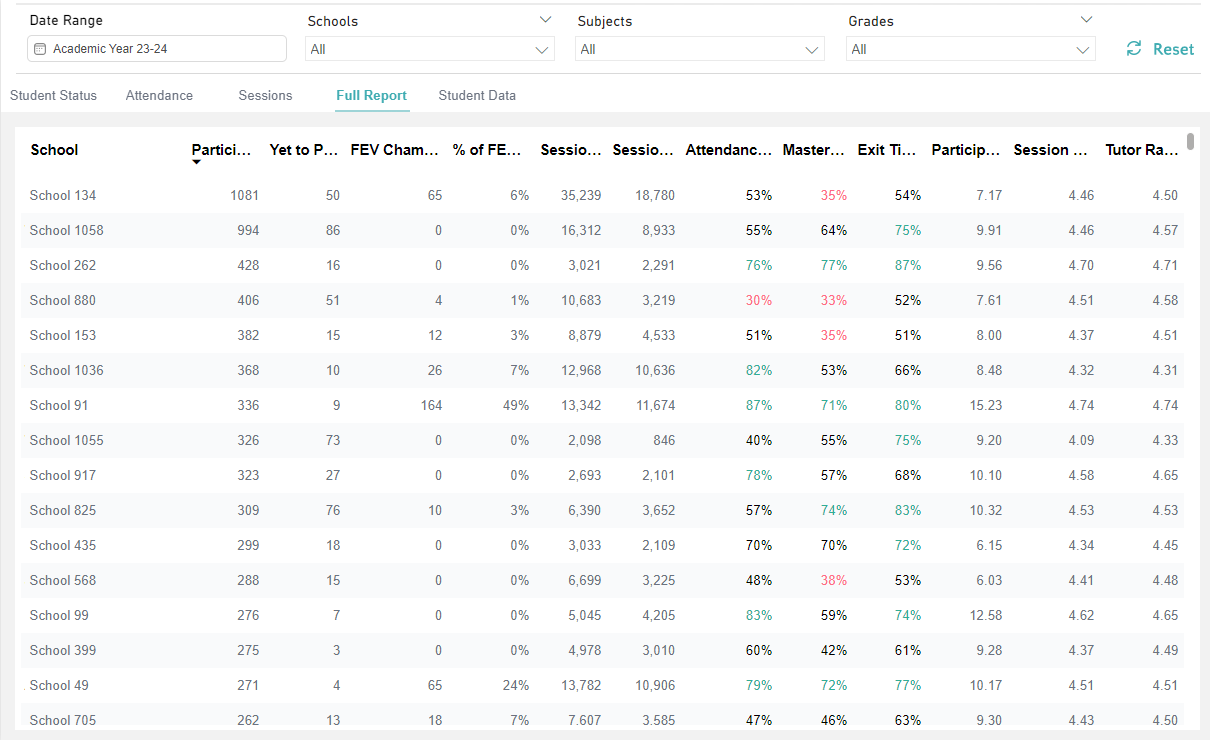
Full Report
Select the "Full Report" tab across the top to see all previous information in one report, able to export data to Excel
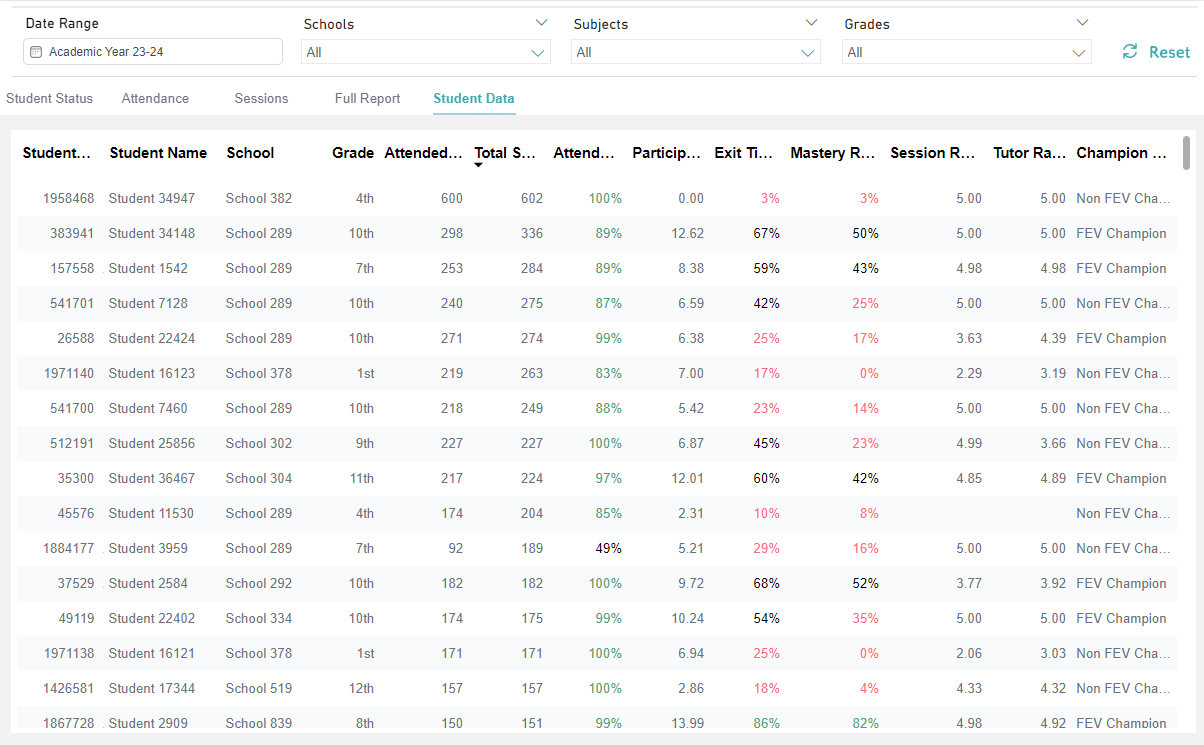
Student Data Detail Review
Select the "Student Data" tab across the top to see all previous information in one report by student, able to export data to Excel
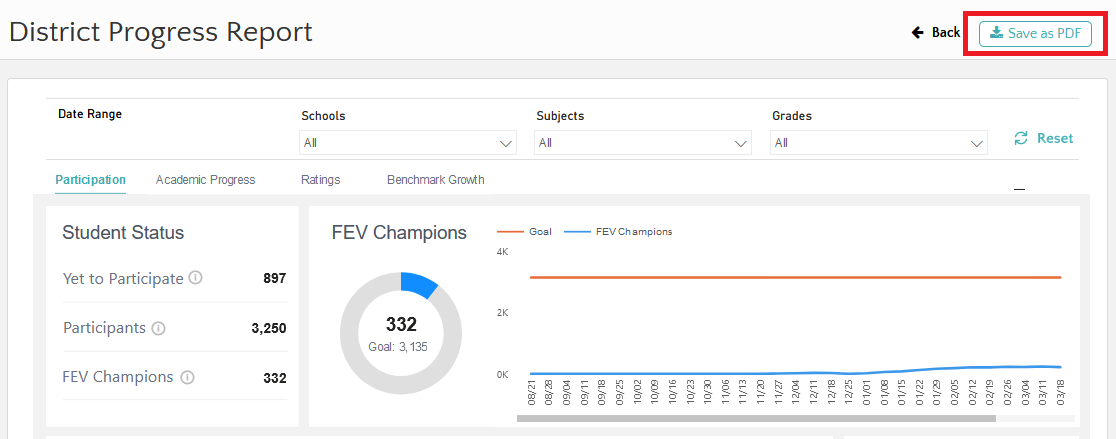
Save as PDF
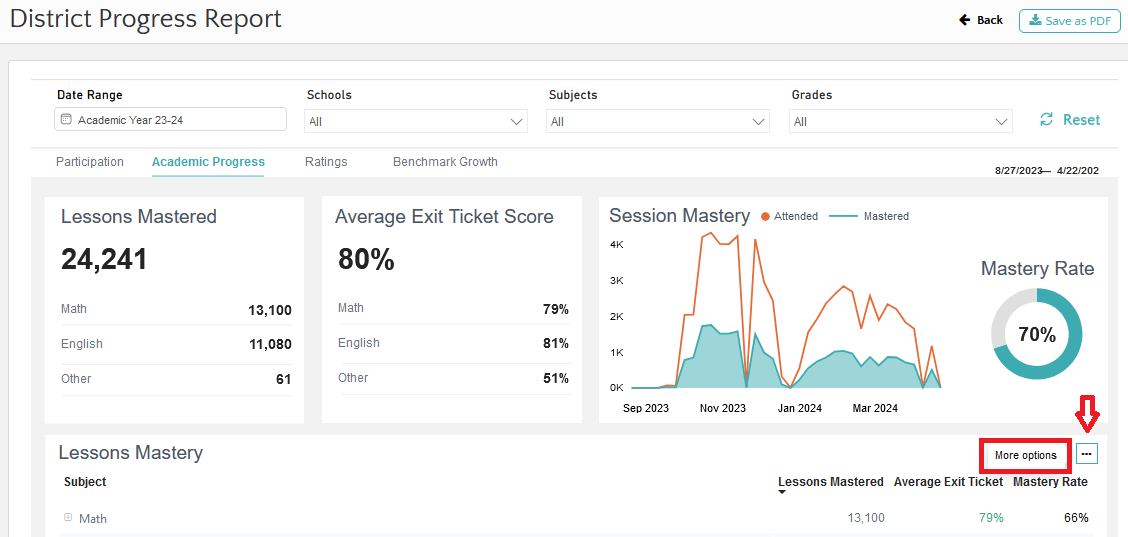
At the top right of the page there is an Export to PDF button for all reports on all pages.
Clicking “Save as PDF” will give you a pop-up, as shown below. The request is accepted, and the PDF will be downloaded in a couple of minutes.
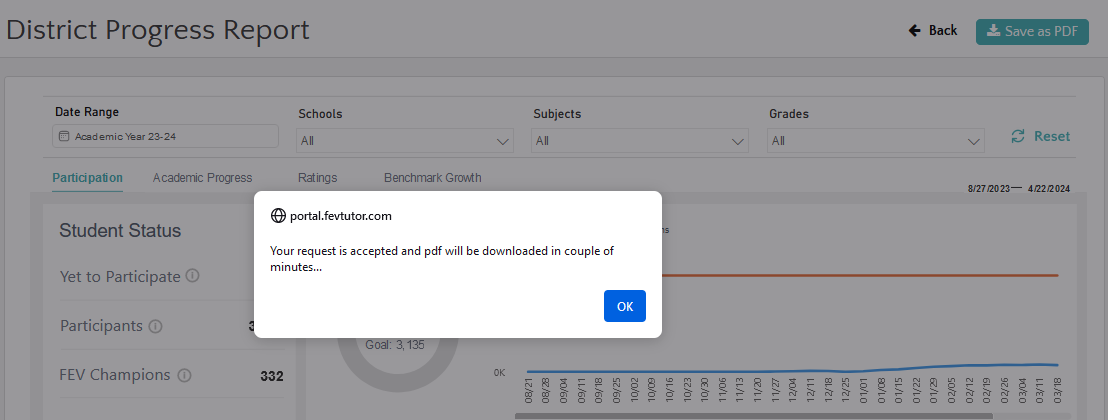
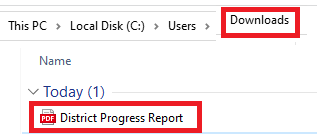
The downloaded PDF will be found in your “Downloads” with its respective label.
Upon downloading, the User can launch the PDF through any browser for view/ print. Print screen icons from your browser will orient the page to the layout of your choice. Pick ‘Landscape’ for better orientation, and if two pages show up, then select the first page only.
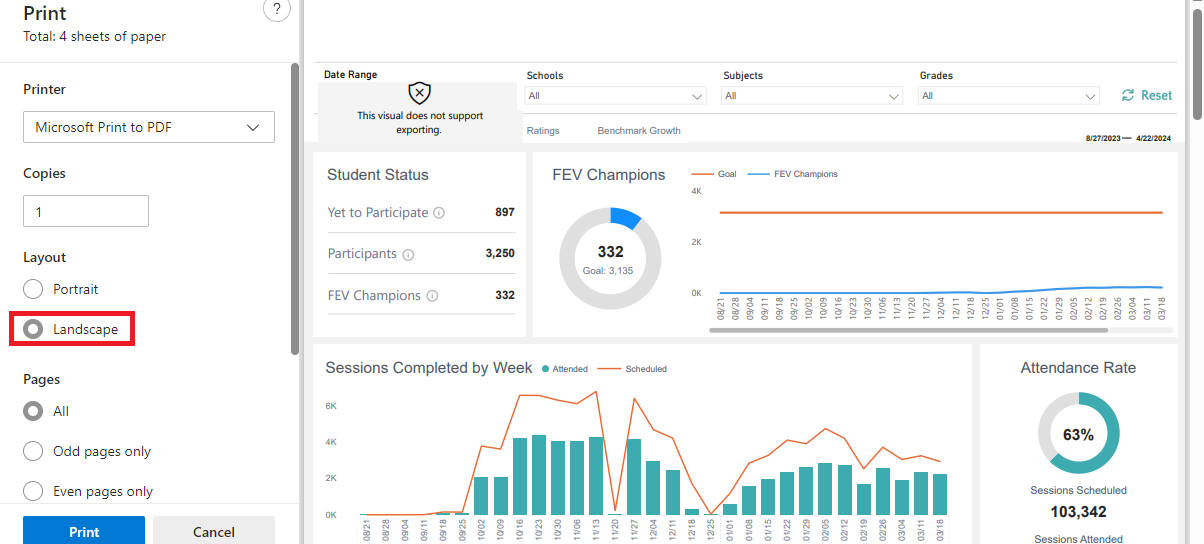
Note: Print options vary from one browser to another. Choose the configuration accordingly to exhibit a clear view of data. Preview before print!
Export to Excel
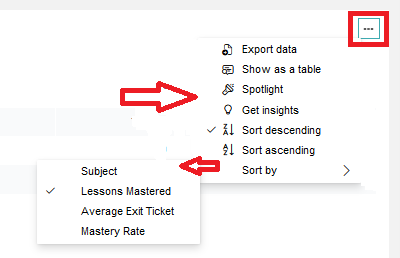
Hovering over a few sections will give you three dots for “More options.”
"More Options" leads to:
Export Data
Show as a Table
Spotlight
Get Insights
Sort descending
Sort ascending
Sort by
Subject
Lessons Mastered
Average Exit Ticket
Mastery Rate.
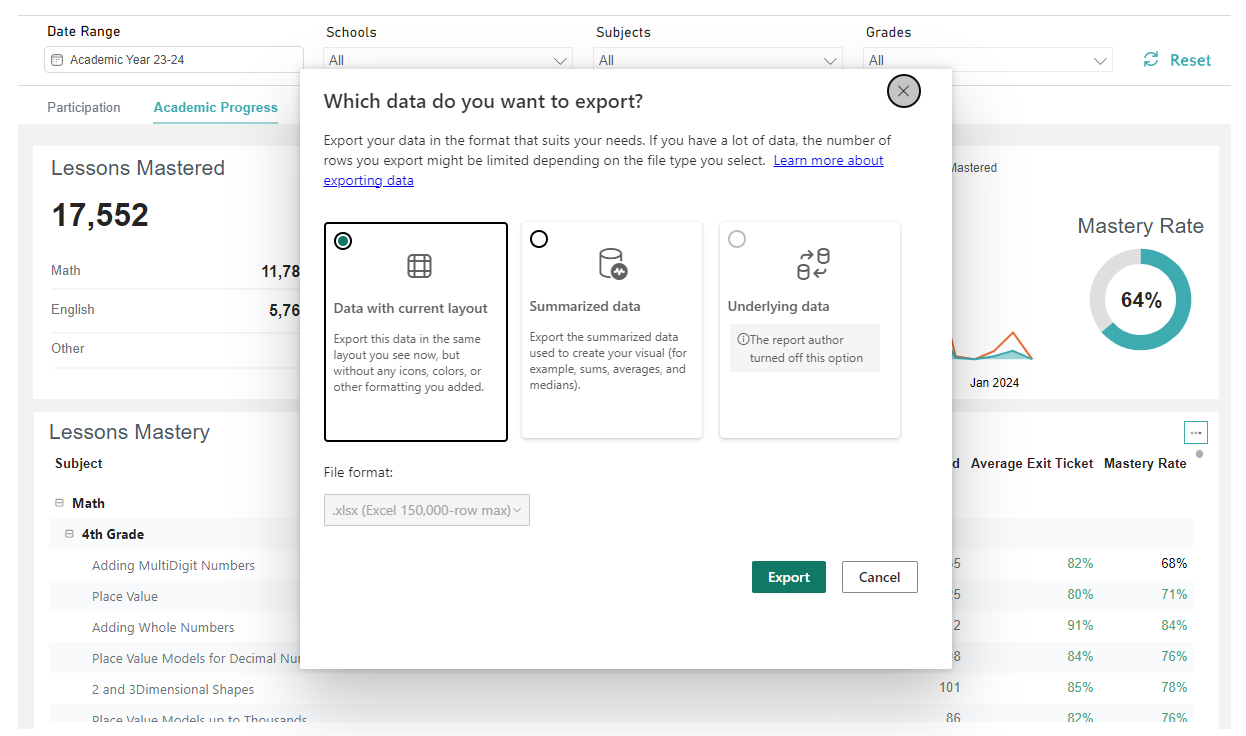
"Export data" leads to
Data with the current layout
Summarized data
Underlying data
Choosing any of the above to “Export” will give you the requested data in “downloads.”
Device Compatibility
Windows (7, 10, 11)
Chrome: Full functionality with zoom and scroll options in various resolutions.
FireFox: Full functionality with zoom and scroll options in various resolutions except for the 'Save as PDF' feature (landscape mode not available).
Edge: Similar functionality to Chrome.
Mac (Sonoma, Ventura, Monterey)
Safari: Limited usability below 1600x900 resolution (no scroll bar for zoomed-in reports), minor visual issues in 'Save as PDF'.
Chrome: Good functionality, zoom function works correctly, scroll functions do not work while zoomed into the report, minor visual issues in 'Save as PDF'.
Mobile Devices (iPhones, Androids, Tablets)
Overall: Extremely limited functionality. Reports not fully viewable, issues with vertical scrolling lead to not being able to view the whole report