Network Progress Report
Network Progress Report
The Network Progress Report is an essential tool for network administrators, offering a holistic overview of the district's performance in the FEV Program across all districts. It provides vital data, including student participation levels, achievement against FEV Champions targets, session attendance rates, and academic progress in various lesson domains. Additionally, it offers insights into student feedback on sessions and tutors, and evaluates the Return on Investment (ROI) through benchmark assessments like NWEA, iReady, or STAR. This report is invaluable for network administrators aiming to enhance student engagement and academic performance and ensure the effectiveness of the FEV Program.
Participation
Choose the ‘Participation’ tab across the top in order to track participation as students progress towards your district FEV Champion goal. As a refresher, students earn FEV Champion status whenever they attend 21 or more sessions and earn an average of 11 participation points or more per session.
Configure your preferred Date Range, School(s), Subject(s), and Grade(s) or stick with these default filters:
Range - Academic Year (August 1st of the current school year through present day)
School(s) - All (includes all schools in the district)
Subject(s) - All (includes all tutored subjects)
Grade(s) - All (includes the grade levels of all participating students)
Note: your selected filters will apply universally to all components of the below reports.
Review the following components:
Review the following components:
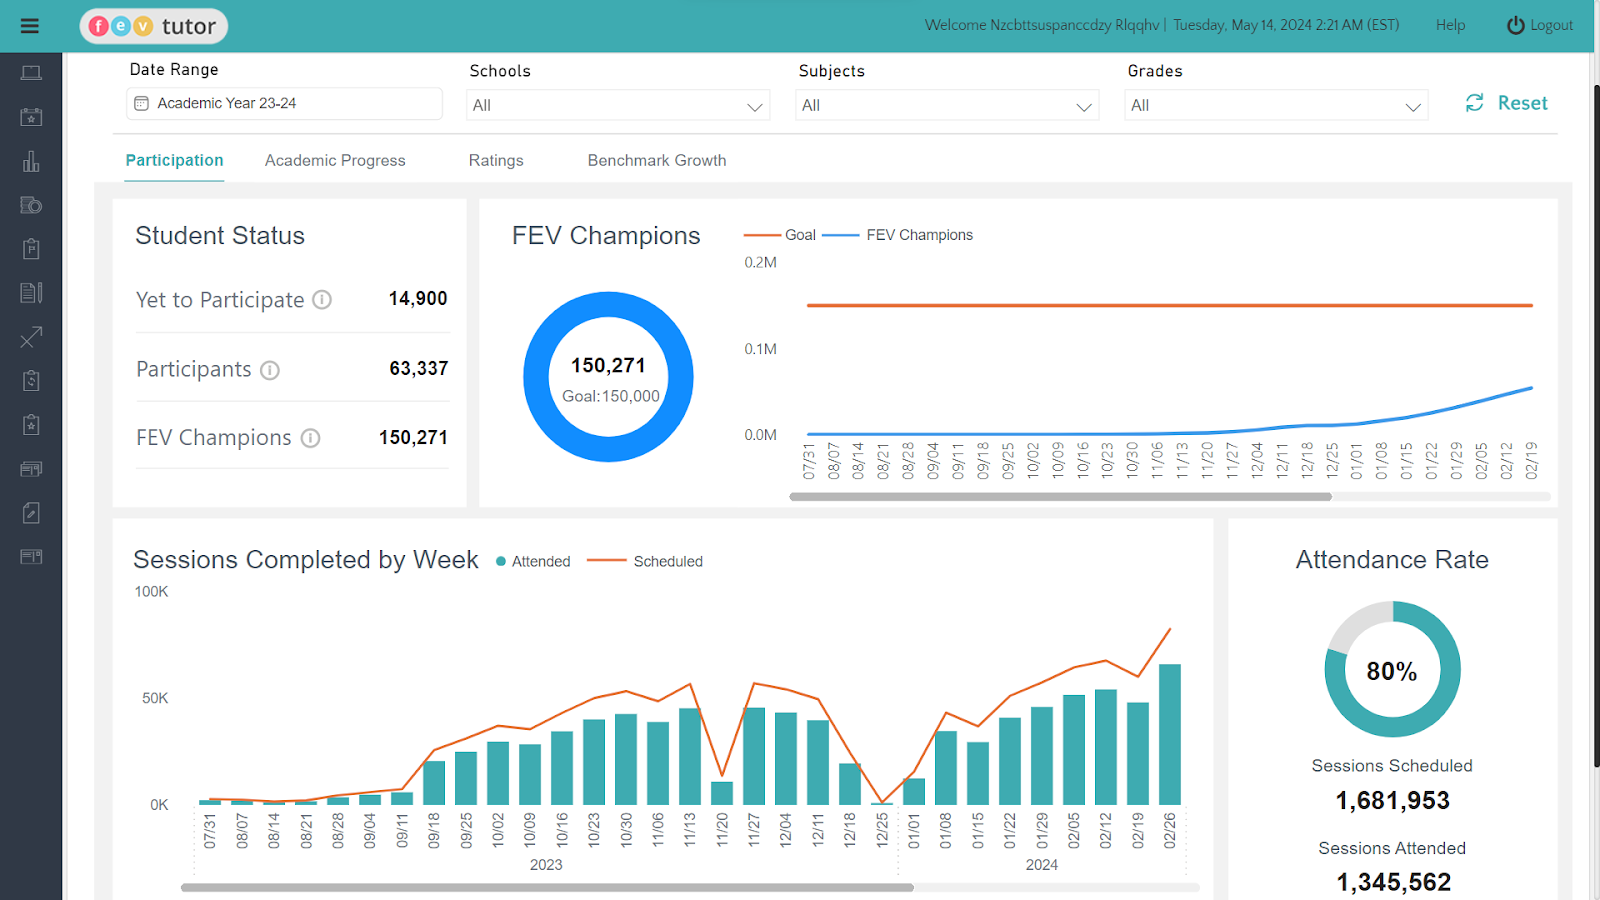
Student Status (top left)
Yet to Participate - students who have been scheduled for tutoring but have not yet attended a session
Participants - students who have completed one or more tutoring sessions. Includes FEV Champions.
FEV Champions - high-performing students who have completed 21 or more sessions AND have earned an average of 11 or more participation points per session.
FEV Champion Tracker (top right)
Goal - district FEV Champion goals are typically set during program planning and implementation. It is your target number of FEV Champions for the current school year. If you have questions about your district’s goal, we recommend contacting your assigned Customer Success Manager.
FEV Champions - the number of high-performing students who have completed 21 or more sessions AND have earned an average of 11 or more participation points per session.
Session Completed by Week (bottom left)
Here is where you can view Attended (blue) vs. Scheduled (orange) sessions over time by week.
Attendance Rate (bottom right)
Displayed is the overall attendance rate (Attended vs. Scheduled Sessions) for the date range you’ve selected in the top filters.
Academic Progress
Choose the "Academic Progress" tab across the top to monitor how students are performing on their formative assessment Exit Tickets by subject, over time, and by domain.
Configure your preferred Date Range, School(s), Subject(s), and Grade(s) or stick with these default filters:
Date Range - Academic Year (August 1st of the current school year through present day)
School(s) - All (includes all schools in the district)
Subject(s) - All (includes all tutored subjects)
Grade(s) - All (includes the grade levels of all participating students)
Note: your selected filters will apply universally to all components of the below reports.
Review the following components:
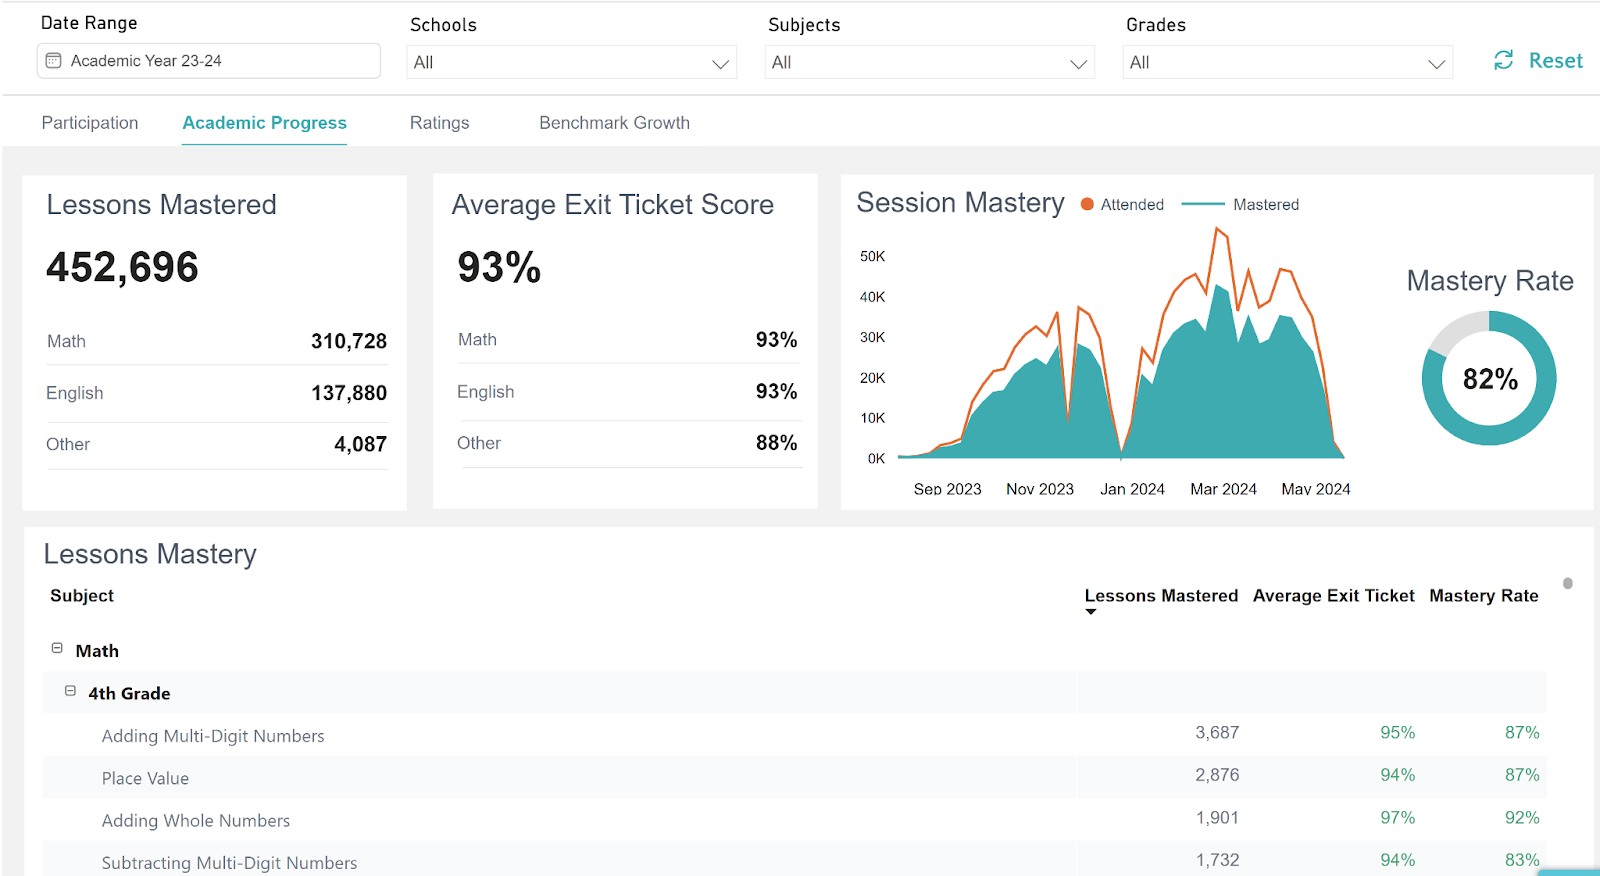
Lessons Mastered (top left) - the total number of lessons mastered by math, English, and other subjects.
Average Exit Ticket Score (top middle) - the average of all of the Exit Ticket formative assessments (short quizzes completed at the end of each session) by math, English, and other subjects.
Session Mastery (top right) - mastery rate (mastered vs. attended sessions) displayed over time.
Lessons Mastery (bottom) - tabular display of academic performance across the districts with the ability to drill down from subject, grade to domain. Able to export data to Excel.
Ratings
Choose the "Ratings" tab across the top to see average session and tutor ratings and the comments since the beginning of the current Academic Year. Students rate their session ("Session Rating”) and their tutor ("Tutor Rating") at the end of each tutoring session while also leaving comments about their experience.
Configure your preferred Date Range, School(s), Subject(s), and Grade(s) or stick with these default filters:
Date Range - Academic Year (August 1st of the current school year through present day)
School(s) - All (includes all schools in the district)
Subject(s) - All (includes all tutored subjects)
Grade(s) - All (includes the grade levels of all participating students)
Note: your selected filters will apply universally to all components of the below reports.
Review the following components:
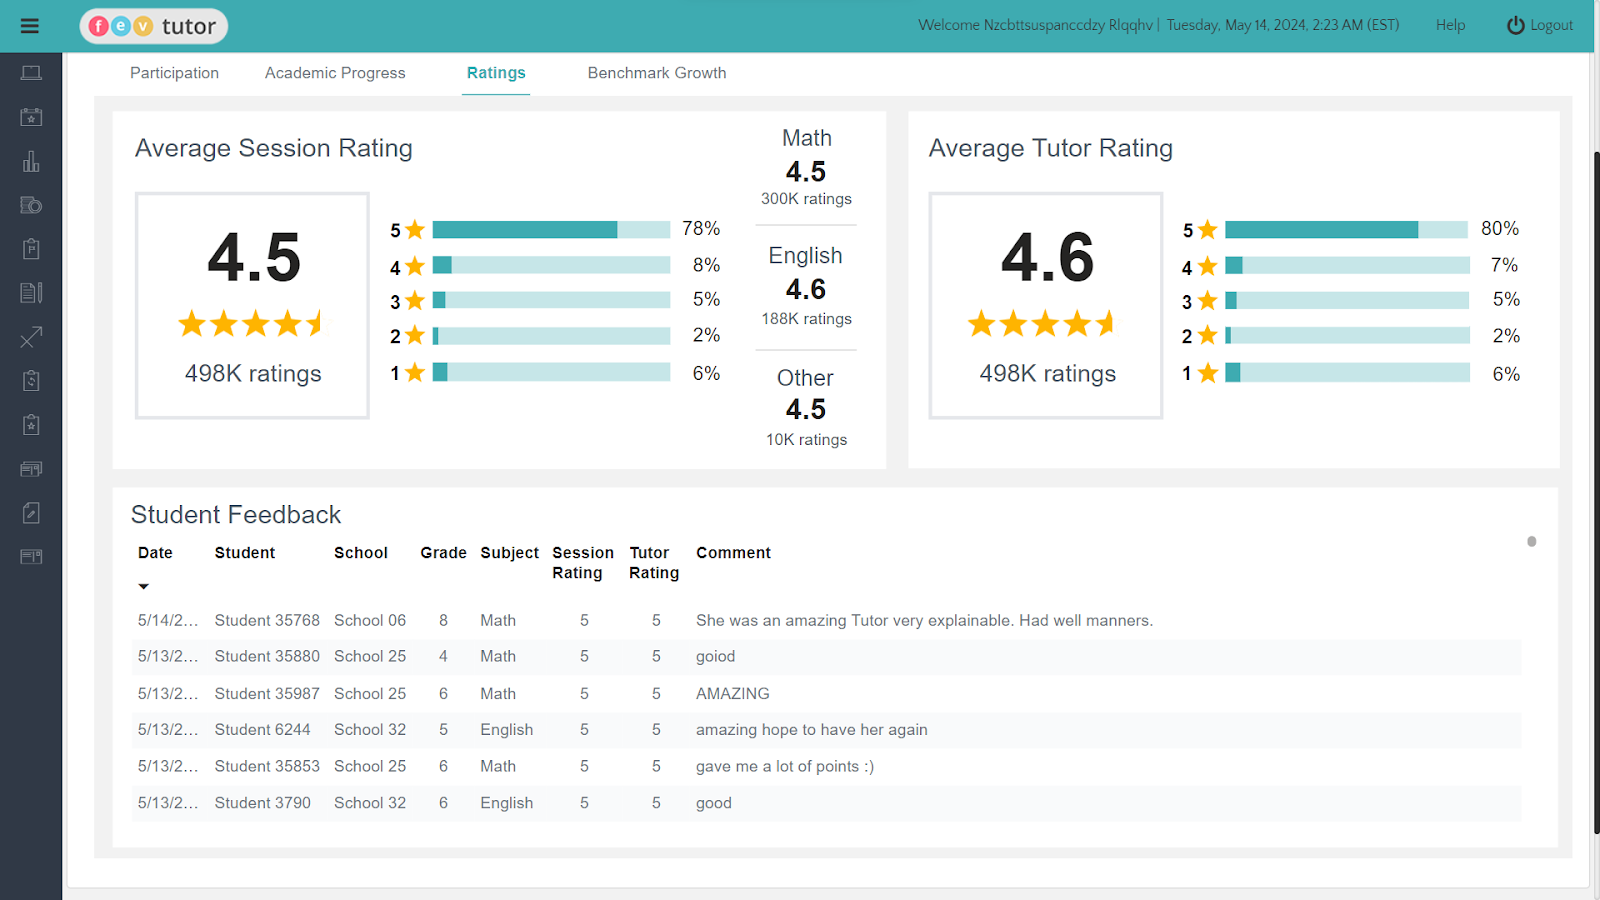
Average Session Rating (top left) - the average session rating given by students broken down by each rating level and subject
Average Tutor Rating (top right) - the average tutor rating given by students broken down by each rating level.
Student Feedback (bottom) - tabular display of student comments about sessions. Able to export data to Excel.
Benchmark Growth
Visit the "Benchmark Growth" tab to see how tutoring participation correlates with benchmark growth acceleration for districts who use MAP Growth, iReady or Star benchmarks.
Configure your preferred Date Range, School(s), Subject(s), and Grade(s) or stick with these default filters:
Date Range - Academic Year (August 1st of the current school year through present day)
School(s) - All (includes all schools in the district)
Subject(s) - All (includes all tutored subjects)
Grade(s) - All (includes the grade levels of all participating students)
Note: your selected filters will apply universally to all components of the below reports.
Review the following components:
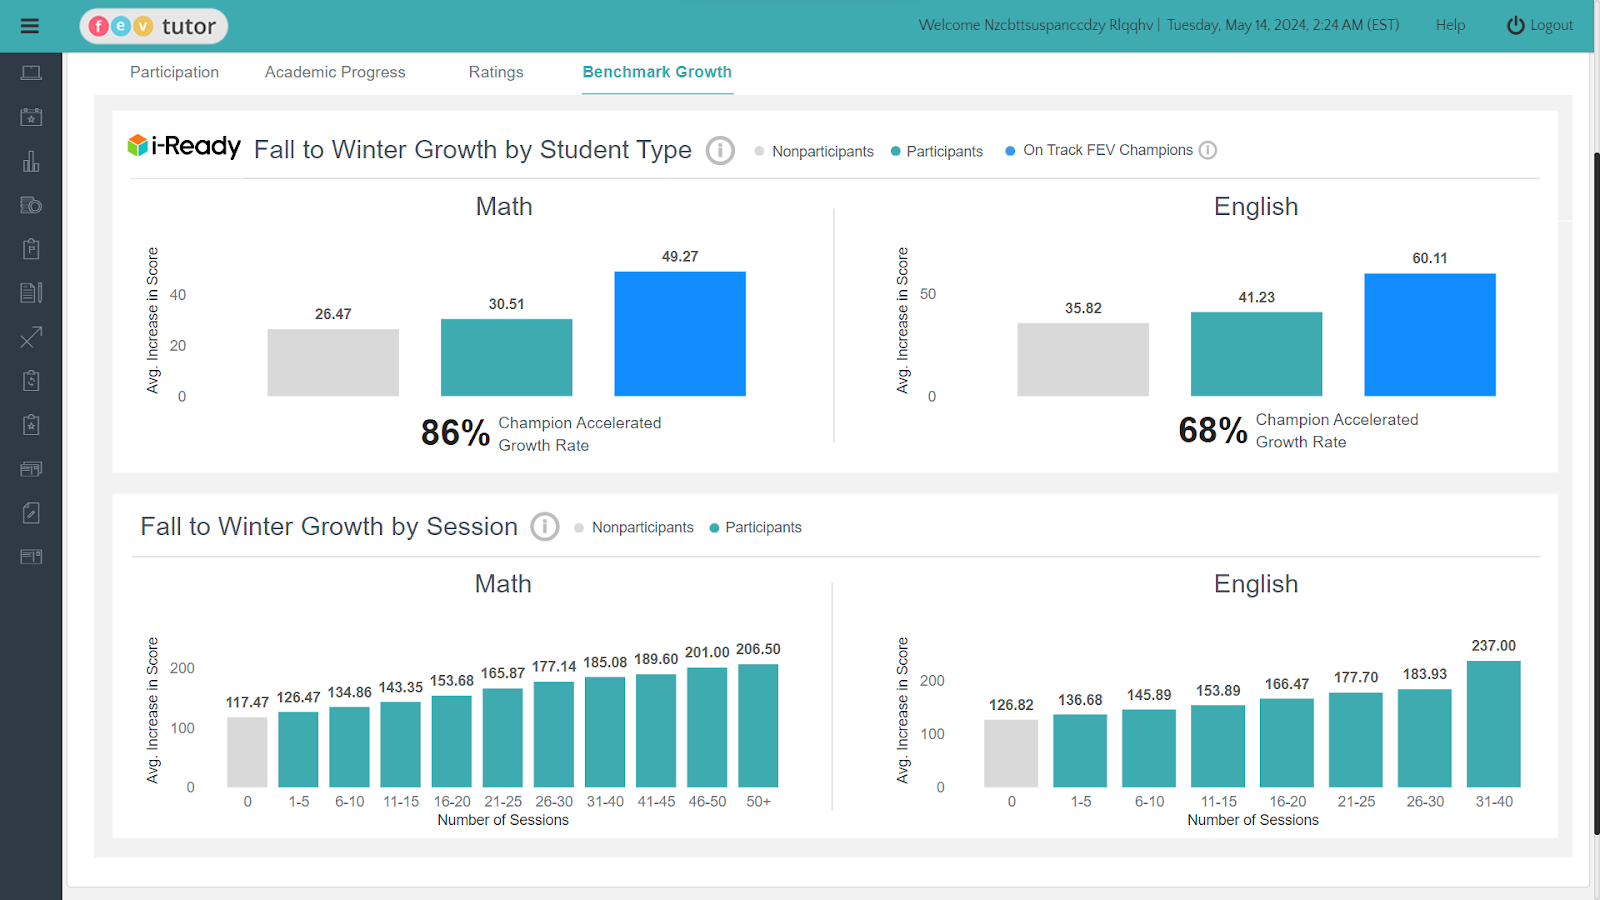
Fall to Winter Math Benchmark Growth (top left) - the average growth by students between their Fall and Winter benchmark exams (iReady, STAR, NWEA). Shows the accelerated growth rate between non participants and On Track FEV Champions.
On Track FEV Champions are students who have completed 10 or more sessions and have an average of 11 participation points per session.
Fall to Winter English Benchmark Growth (top right) - the average growth by students between their Fall and Winter benchmark exams (iReady, STAR, NWEA). Shows the accelerated growth rate between non participants and On Track FEV Champions.
On Track FEV Champions are students who have completed 10 or more sessions and have an average of 11 participation points per session.
Student Math Growth by number of sessions completed (bottom-left)- the average growth by students based on number of sessions completed.
Student English Growth by number of sessions completed (bottom-right)- the average growth by students based on number of sessions completed.
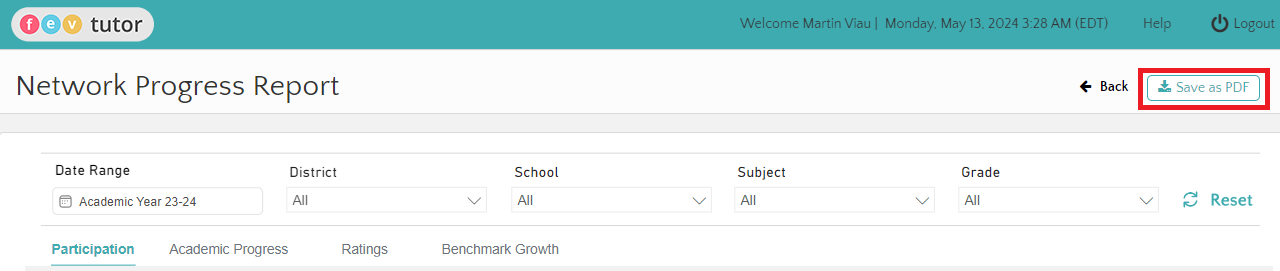
Save as PDF
At the top right of the page there is an Export to PDF button for all reports on all pages.
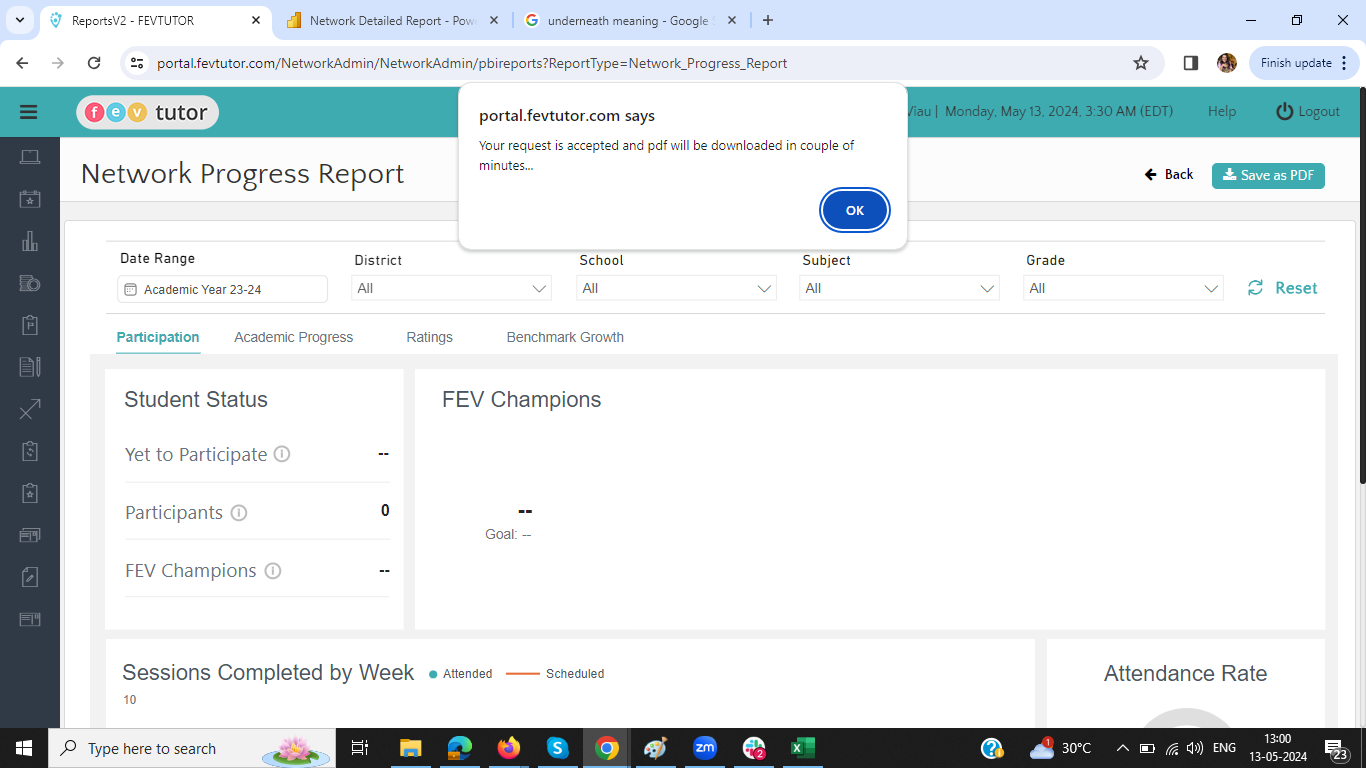
Clicking “Save as PDF” will give you a pop-up, as shown below. The request is accepted, and the PDF will be downloaded in a couple of minutes.
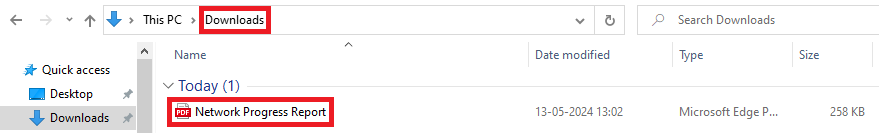
The downloaded PDF will be found in your “Downloads” with its respective label.
Upon downloading, the User can launch the PDF through any browser for view/ print. Print screen icons from your browser will orient the page to the layout of your choice. Pick ‘Landscape’ for better orientation, and if two pages show up, then select the first page only.
Note: Print options vary from one browser to another. Choose the configuration accordingly to exhibit a clear view of data. Preview before print!
Export to Excel
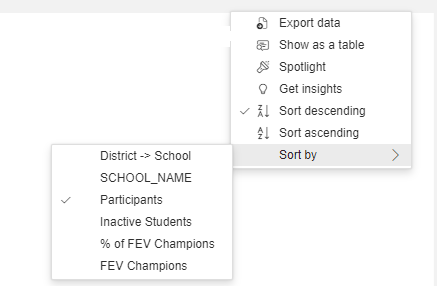
Hovering over a few sections will give you three dots for “More options.”
"More Options" leads to:
Export data
Show as a table
Spotlight
Get Insights
Sort descending
Sort ascending
Sort by
District → School
School_Name
Participants
Inactive Students
% of FEV Champions
FEV Champions
Device Compatibility
Windows (7, 10, 11)
Chrome: Full functionality with zoom and scroll options in various resolutions.
FireFox: Full functionality with zoom and scroll options in various resolutions except for the 'Save as PDF' feature (landscape mode not available).
Edge: Similar functionality to Chrome.
Mac (Sonoma, Ventura, Monterey)
Safari: Limited usability below 1600x900 resolution (no scroll bar for zoomed-in reports), minor visual issues in 'Save as PDF'.
Chrome: Good functionality, zoom function works correctly, scroll functions does not work while zoomed into report, minor visual issues in 'Save as PDF'.
Mobile Devices (iPhones, Androids, Tablets)
Overall: Extremely limited functionality. Reports not fully viewable, issues with vertical scrolling leads to not being able to view whole report
White Label Sites
For our clients utilizing White Label Sites, the remarkable reports are set to be released on White Label Sites soon after their debut on our main platform. This upcoming feature ensures that our White Label Sites users will not miss out on the advanced analytics and comprehensive insights offered by these reports. Stay tuned for more details on the release schedule and how to access these reports on your customized White Label Site.