School Teacher Report
School Teacher Report

The Teacher Report is an essential tool for Teachers, providing a comprehensive summary of their students' performance in the FEV Program. This report includes detailed information on Student Participation rates, achievement of FEV Champions, Session Attendance, and Academic Progress across various lesson domains.
Additionally, the Teacher Report gathers insights from Student Feedback on Sessions and Tutors and evaluates the Return on Investment (ROI) through benchmark assessments such as NWEA, iReady, or STAR. This valuable report helps teachers enhance student engagement, improve academic outcomes, and verify the effectiveness of the FEV Program in their classrooms.
Participation
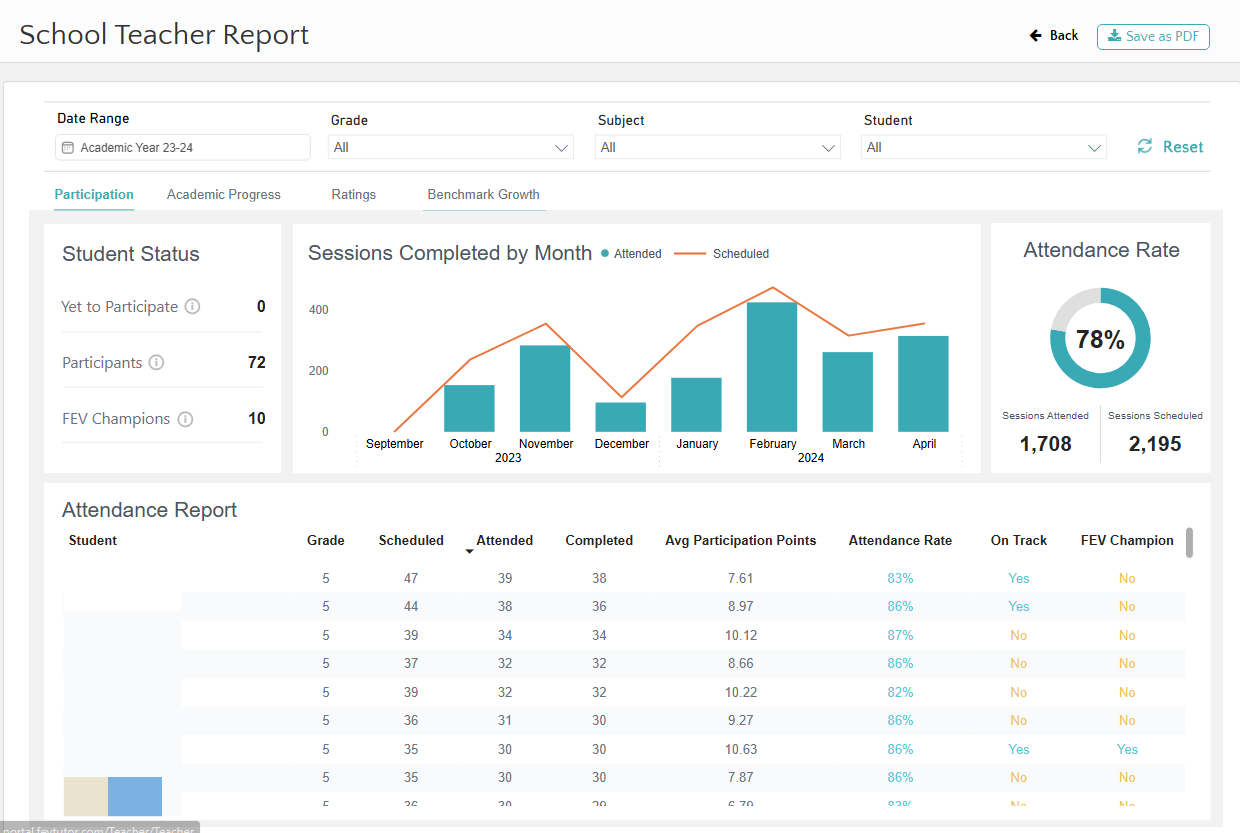
Choose the "Participation" tab to track participation as students progress towards your district FEV Champion goal. As a refresher, students earn FEV Champion status whenever they attend 21 or more sessions and earn an average of 11 participation points or more per session.
Configure your preferred Date Range, Grade(s), Subject(s) and Student(s) or stick with these default filters:
Date Range: Academic Year (August 1st of the current school year through the present day)
Grade(s): All (includes the grade levels of all participating students)
Subject(s): All (includes all tutored subjects) or pick individual subjects: Math, English, Social Studies and Science
Student(s): All (includes all students) or pick individual students or a group of students
Review the following components:
Student Status (top-left)
Yet to Participate: students who have been scheduled for tutoring but have not attended a session
Participants: students who have completed one or more tutoring sessions. This includes FEV Champions
FEV Champions: high-performing students who have completed 21 or more sessions AND have earned an average of 11 or more participation points per session
Sessions Completed by Week (middle-left)
This is where you can view Attended (blue) vs. Scheduled (orange) sessions over time by week
Attendance Rate (top-right)
Displays the overall attendance rate (Attended vs. Scheduled Sessions) for the date range you’ve selected in the top filters
Attendance Report (bottom)
Displays all students and the number of sessions attended, attendance rates, average participation points, and whether they have achieved FEV Champion Status
Academic Progress
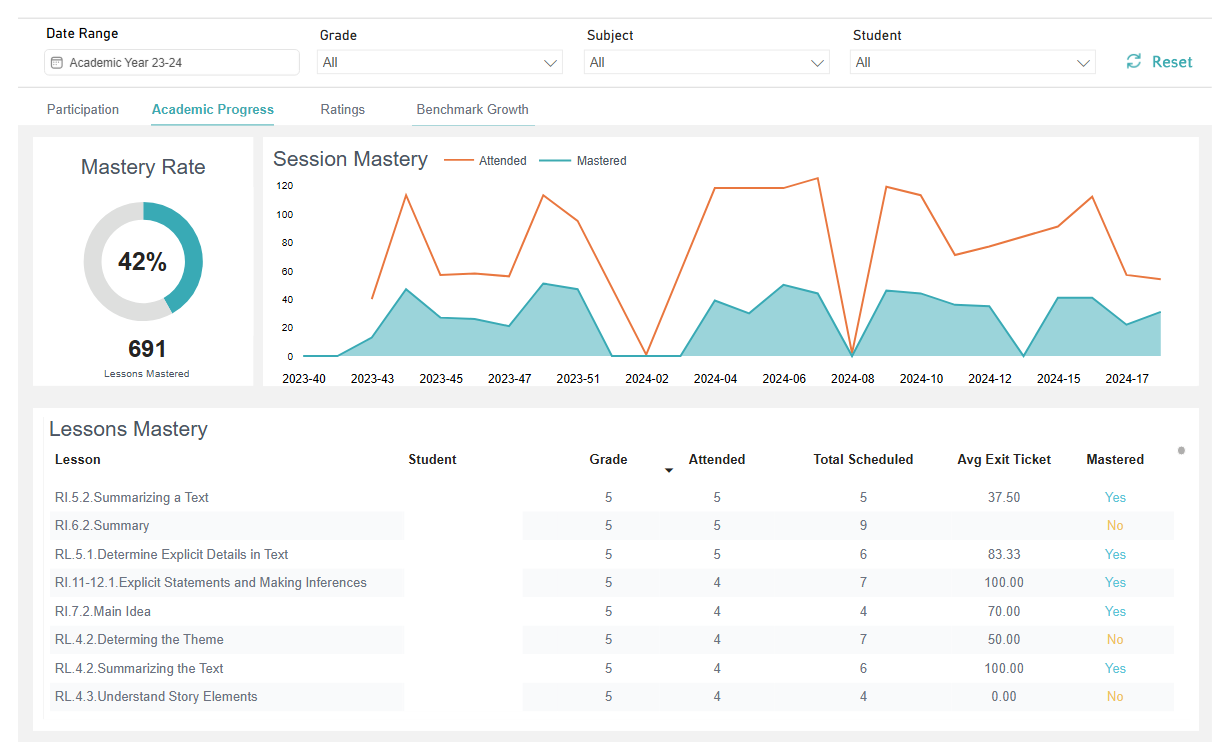
Choose the "Academic Progress" tab across the top to monitor how students are performing on their formative assessment Exit Tickets by subject, over time, and by domain.
Configure your preferred Date Range, Grade(s), Subject(s) and Student(s) or stick with these default filters:
Date Range: Academic Year (August 1st of the current school year through the present day)
Grade(s): All (includes the grade levels of all participating students)
Subject(s): All (includes all tutored subjects) or pick individual subjects: Math, English, Social Studies and Science
Student(s): All (includes all students) or pick individual students or a group of students
Note: your selected filters will apply universally to all components of the below reports.
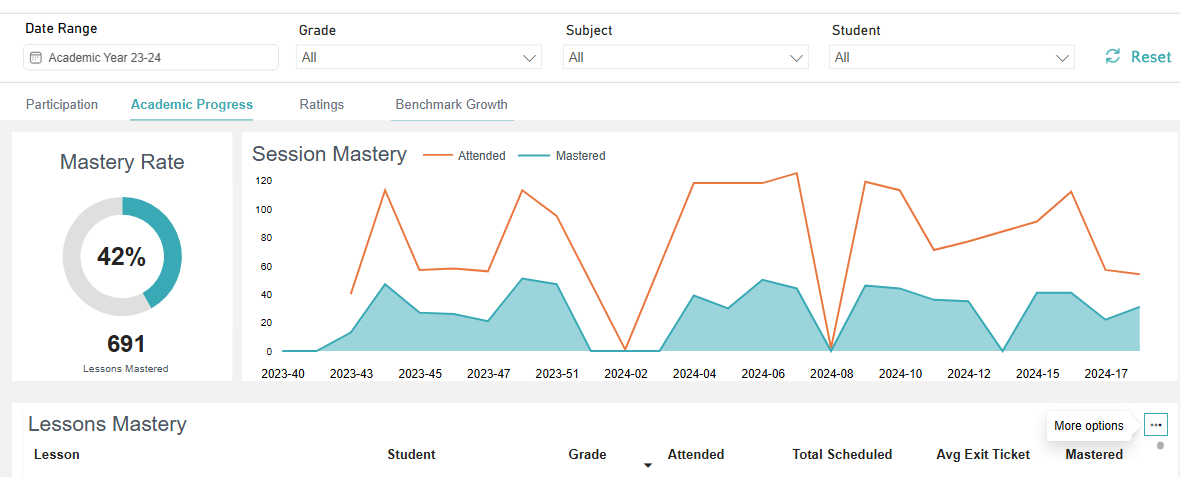
Review the following components:
Lessons Mastered / Mastery Rate (top-left): the total number of lessons mastered and the mastery rate.
Session Mastery (top-right): mastery rate (mastered vs. attended sessions) displayed over time.
Lessons Mastery (bottom): tabular display of academic performance across standards (able to export data to Excel)
Ratings
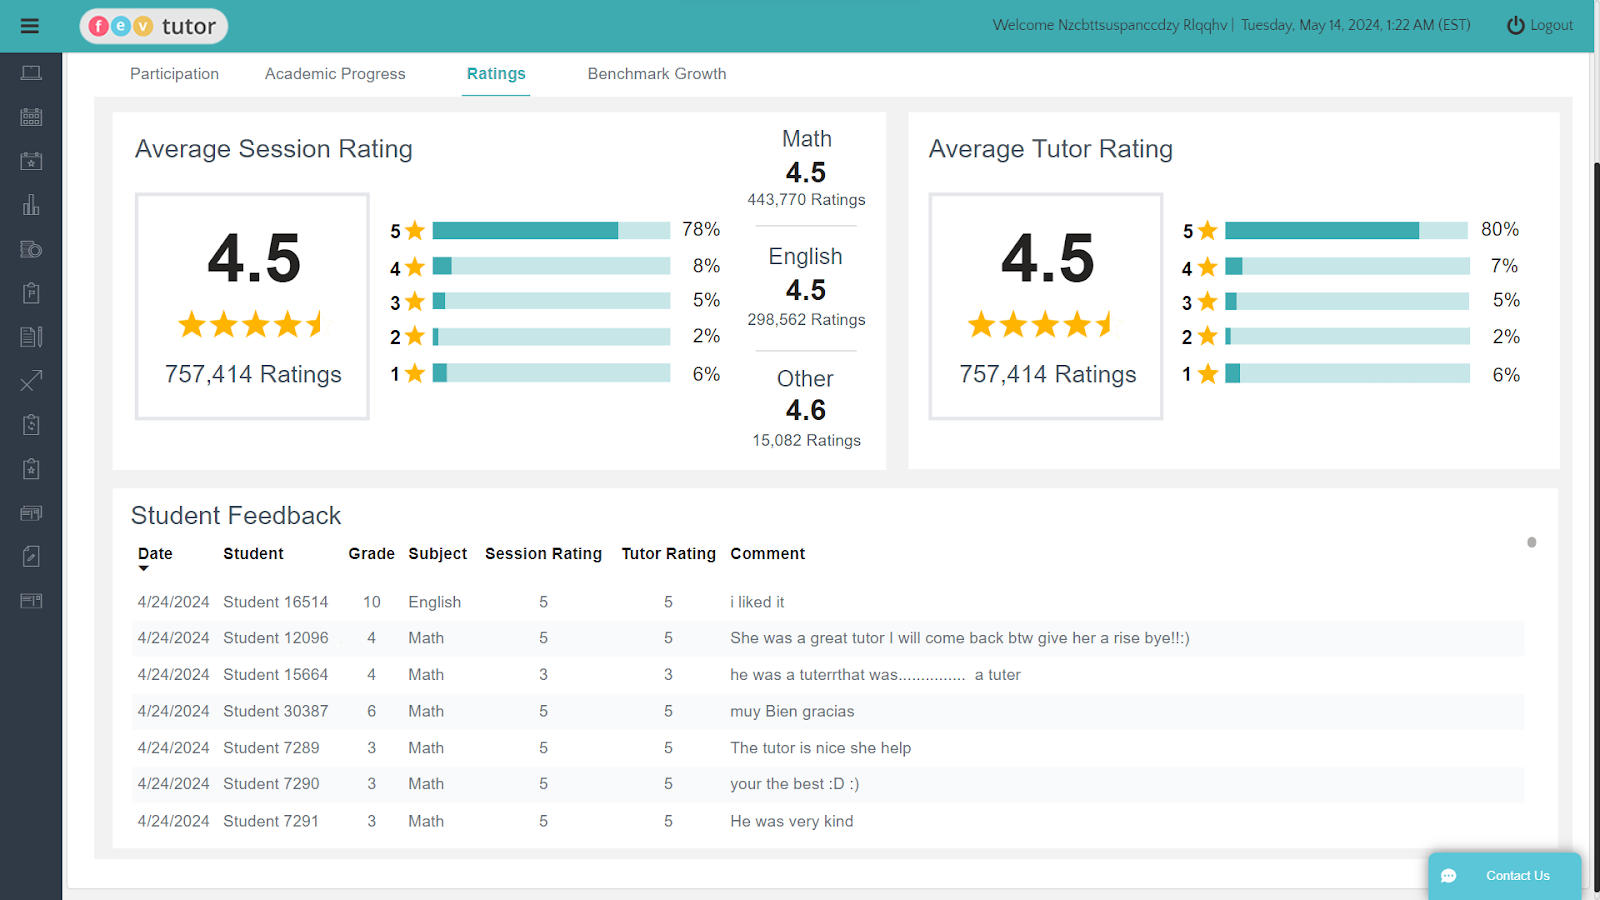
Choose the "Ratings" tab across the top to see average session and tutor ratings and the comments since the beginning of the current Academic Year. Students rate their session ("Session Rating”) and their tutor ("Tutor Rating") at the end of each tutoring session while also leaving comments about their experience.
Configure your preferred Date Range, Grade(s), Subject(s) and Student(s) or stick with these default filters:
Date Range: Academic Year (August 1st of the current school year through the present day)
Grade(s): All (includes the grade levels of all participating students)
Subject(s): All (includes all tutored subjects) or pick individual subjects: Math, English, Social Studies and Science
Student(s): All (includes all students) or pick individual students or a group of students
Note: your selected filters will apply universally to all components of the below reports.
Review the following components:
Average Session Rating (top left) - the average session rating given by students broken down by each rating level and subject
Average Tutor Rating (top right) - the average tutor rating given by students broken down by each rating level.
Student Feedback (bottom) - tabular display of student comments about sessions. Able to export data to Excel.
Benchmark Growth
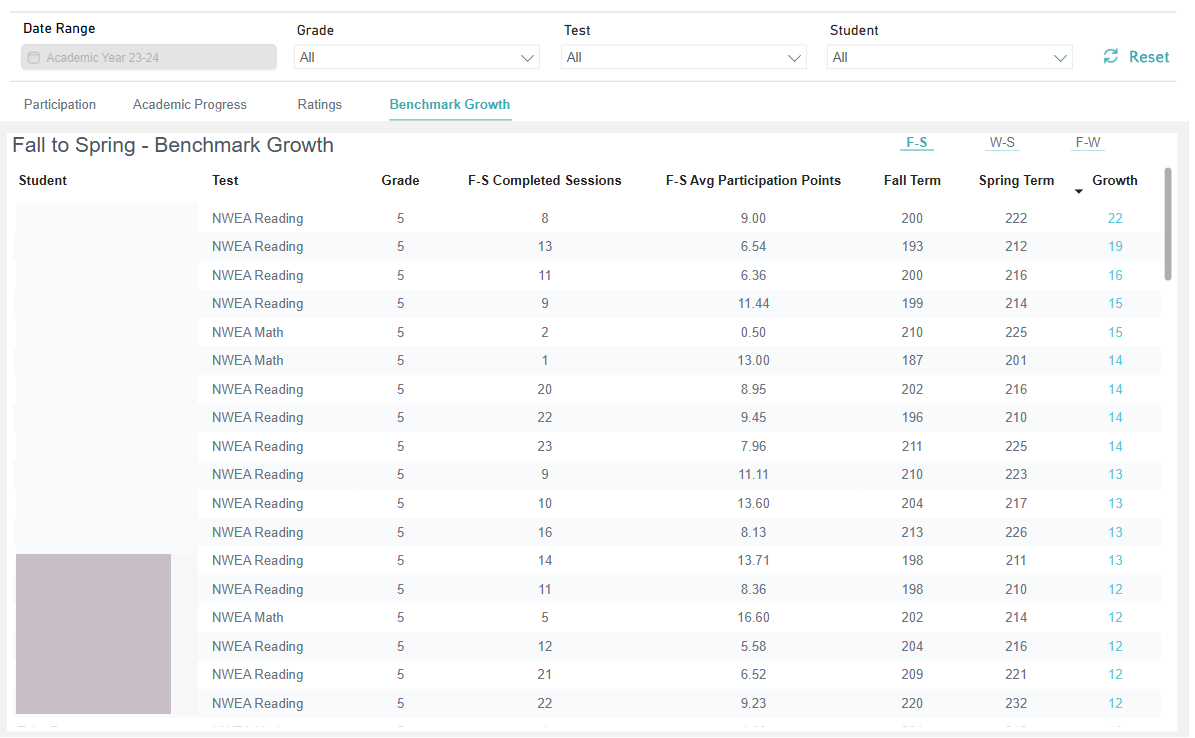
Visit the “Benchmark Growth” tab to see how your students performed for subjects under MAP Growth, iReady, or Star benchmarks.
Configure your preferred Date Range, Subject(s), and Grade(s) or stick with these default filters:
Date Range: Academic Year (August 1st of the current school year through the present day)
Subject(s): All (includes all tutored subjects)
Grade(s): All (includes the grade levels of all participating students)
Note: your selected filters will apply universally to all components of the below reports.
Review the following components:
Benchmark Growth (Middle): This tabular data presents student test scores, completed session counts, and average participation points across different test windows.
Benchmark Window Toggle (Top Right): This will allow teachers to swap between different benchmark windows:
Fall - Spring
Winter - Spring
Fall - Spring
Save as PDF
At the top right of the page, there is an Export to PDF button for all reports on all pages.
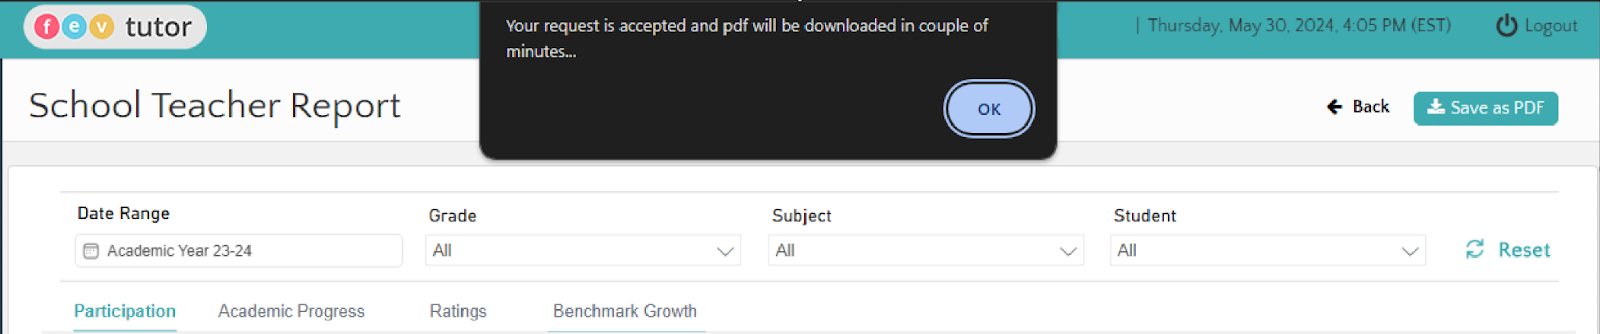
Click on “Save as PDF” to see the pop-up below. The PDF will be downloaded in a couple of minutes.
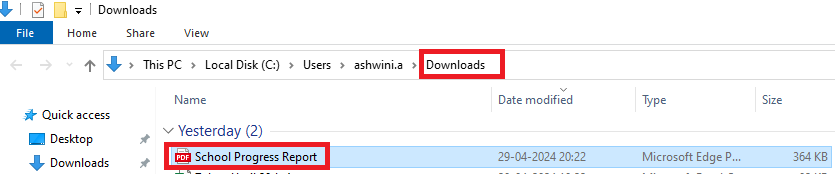
The downloaded PDF will be found in your “Downloads” with its respective label.
Export to Excel
Hovering over a few sections will give you three dots for “More options.”
"More Options" leads to:
Export Data
Show as a Table
Spotlight
Get Insights
Sort descending
Sort ascending
Sort by
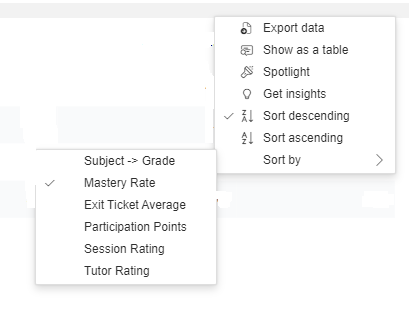
“Export data” leads to:
Data with the current layout
Summarized data
Underlying data
Choosing any of the above to “Export” will give you the requested data in downloads.
Device Compatibility
Windows (7, 10, 11)
Chrome: Full functionality with zoom and scroll options in various resolutions.
FireFox: Full functionality with zoom and scroll options in various resolutions except for the 'Save as PDF' feature (landscape mode not available).
Edge: Similar functionality to Chrome.
Mac (Sonoma, Ventura, Monterey)
Safari: Limited usability below 1600x900 resolution (no scroll bar for zoomed-in reports), minor visual issues in 'Save as PDF'.
Chrome: Good functionality, zoom function works correctly, scroll functions does not work while zoomed into report, minor visual issues in 'Save as PDF'.
Mobile Devices (iPhones, Androids, Tablets)
Overall: Extremely limited functionality. Reports not fully viewable, issues with vertical scrolling leads to not being able to view whole report
White Label Sites
For our clients utilizing White Label Sites, the remarkable reports are set to be released on White Label Sites soon after their debut on our main platform. This upcoming feature ensures that our White Label Sites users will not miss out on the advanced analytics and comprehensive insights offered by these reports. Stay tuned for more details on the release schedule and how to access these reports on your customized White Label Site.